
こんにちは、エンジニアのHKです。
今回はGKEの勉強がてら、helmでkube-prometheus-stackをインストールして、grafanaでGKEとnginxコンテナのメトリクスを表示するまでをやってみました。
まずは土台となるクラスタを用意します。
・クラスタを作成
% gcloud container clusters create gke-monitor-test \
  --zone asia-northeast1-a \
  --num-nodes 1 \
  --machine-type e2-standard-2

NAME                   LOCATION           MASTER_VERSION      MASTER_IP       MACHINE_TYPE   NODE_VERSION        NUM_NODES  STATUS
gke-monitor-test  asia-northeast1-a  1.33.5-gke.2019000  xxx.xxx.xxx.xxx  e2-standard-2  1.33.5-gke.2019000  1          RUNNING

・kubectlを使うためにget-credentials
% gcloud container clusters get-credentials gke-monitor-test --zone asia-northeast1-a
次にkube-prometheus-stackをインストールしてクラスタのメトリクスを取得できるようにします。
・helmでkube-prometheus-stackをインストール
% helm repo add prometheus-community https://prometheus-community.github.io/helm-charts
% helm repo update
% helm install prometheus-stack prometheus-community/kube-prometheus-stack \
  --namespace monitoring \
  --create-namespace
kube-prometheus-stackでメトリクスを収集する準備ができました。
% kubectl get pods -n monitoring
NAME                                                     READY   STATUS    RESTARTS   AGE
alertmanager-prometheus-stack-kube-prom-alertmanager-0   2/2     Running   0          2m12s
prometheus-prometheus-stack-kube-prom-prometheus-0       2/2     Running   0          2m11s
prometheus-stack-grafana-744d449fcf-jxkln                3/3     Running   0          2m18s
prometheus-stack-kube-prom-operator-79d778fc78-4pmfz     1/1     Running   0          2m18s
prometheus-stack-kube-state-metrics-7d6b659ff-kpnfr      1/1     Running   0          2m18s
prometheus-stack-prometheus-node-exporter-w4bn2          1/1     Running   0          2m19s
ポートフォワーディングを使用してgrafanaにアクセスしてみます。
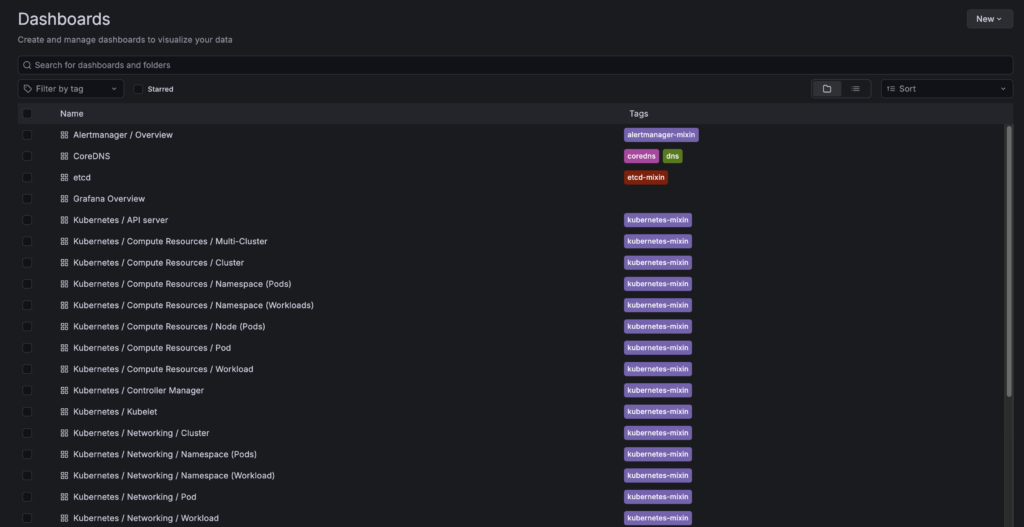
% kubectl port-forward deployment/prometheus-stack-grafana 3000:3000 -n monitoringhttp://localhost:3000最初から多くのダッシュボードが用意されています。
デフォルトで用意されているダッシュボードが豊富なのがkube-prometheus-stackの特徴です。むしろ多すぎて見づらいと感じたら不要なものは取捨していきましょう。
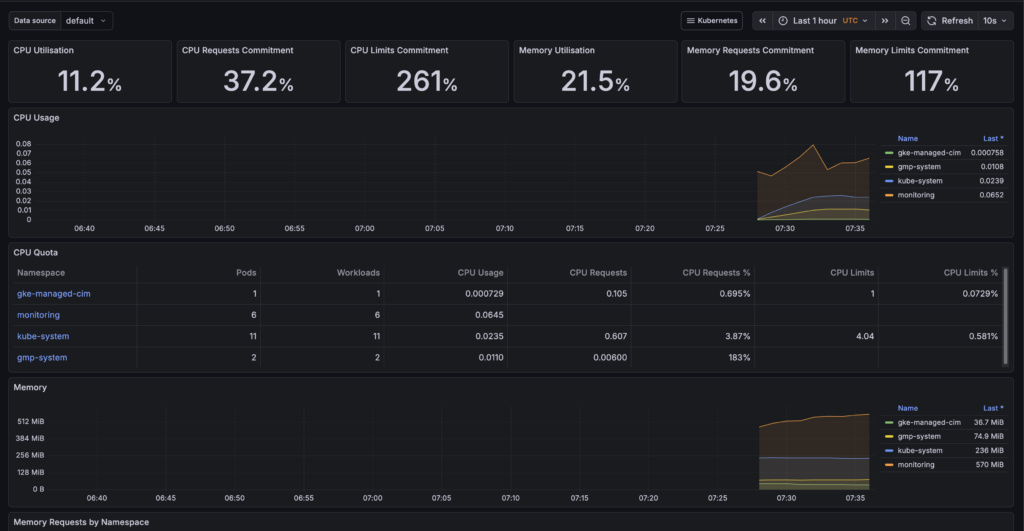
ダッシュボードの中を見るとこんな感じでCPU使用率などのメトリクスは最初から見やすくまとめられています。
デフォルトで見られるメトリクス以外にもなにかサービスのメトリクスも見てみたいので、今回はnginxにします。
・nginx-deployment.yaml
apiVersion: v1
kind: ConfigMap
metadata:
  name: nginx-conf
  namespace: monitoring
data:
  default.conf: |
    server {
        listen 80;
        location / {
            root   /usr/share/nginx/html;
            index  index.html index.htm;
        }

        location /stub_status {
            stub_status on;
            access_log off;
            allow 127.0.0.1;
            deny all;
        }
    }
---
apiVersion: apps/v1
kind: Deployment
metadata:
  name: nginx-test
  namespace: monitoring
  labels:
    app: nginx-test
spec:
  replicas: 1
  selector:
    matchLabels:
      app: nginx-test
  template:
    metadata:
      labels:
        app: nginx-test
    spec:
      containers:
      - name: nginx
        image: nginx:alpine
        ports:
        - containerPort: 80
        volumeMounts:
        - name: nginx-conf
          mountPath: /etc/nginx/conf.d

      - name: nginx-exporter
        image: nginx/nginx-prometheus-exporter:0.11.0
        args:
          - -nginx.scrape-uri=http://127.0.0.1:80/stub_status
        ports:
        - containerPort: 9113
          name: metrics

      volumes:
      - name: nginx-conf
        configMap:
          name: nginx-conf
・nginx-monitor.yaml
apiVersion: v1
kind: Service
metadata:
  name: nginx-test-svc
  namespace: monitoring
  labels:
    app: nginx-test
    release: prometheus-stack
spec:
  type: ClusterIP
  type: LoadBalancer
  loadBalancerSourceRanges:
  - "xxx.xxx.xxx.xxx/32" #自分のIPを許可する接続元として設定
  ports:
  - port: 80
    targetPort: 80
    name: web
  - port: 9113
    targetPort: 9113
    name: metrics
  selector:
    app: nginx-test
---
apiVersion: monitoring.coreos.com/v1
kind: ServiceMonitor
metadata:
  name: nginx-test-monitor
  namespace: monitoring
  labels:
    release: prometheus-stack
spec:
  selector:
    matchLabels:
      app: nginx-test
  endpoints:
  - port: metrics
    interval: 15s
kubectl apply -f nginx-deployment.yaml
kubectl apply -f nginx-monitor.yaml nginxのIP(今回はLB)を確認してアクセスしてみます。
% kubectl get svc nginx-test-svc -n monitoring --watch
NAME             TYPE        CLUSTER-IP       EXTERNAL-IP   PORT(S)           AGE
nginx-test-svc   ClusterIP   xxx.xxx.xxx.xxx   <none>        80/TCP,9113/TCP   47m

・CLUSTER-IP にcurlしてアクセスできることを確認
% curl xxx.xxx.xxx.xxx
<!DOCTYPE html>
<html>
<head>
<title>Welcome to nginx!</title>
<style>
html { color-scheme: light dark; }
body { width: 35em; margin: 0 auto;
font-family: Tahoma, Verdana, Arial, sans-serif; }
</style>
</head>
<body>
<h1>Welcome to nginx!</h1>
<p>If you see this page, the nginx web server is successfully installed and
working. Further configuration is required.</p>

<p>For online documentation and support please refer to
<a href="http://nginx.org/">nginx.org</a>.<br/>
Commercial support is available at
<a href="http://nginx.com/">nginx.com</a>.</p>

<p><em>Thank you for using nginx.</em></p>
</body>
</html>
今のアクセスがメトリクスとして収集できているはずなのでgrafanaを見て確認してみます。
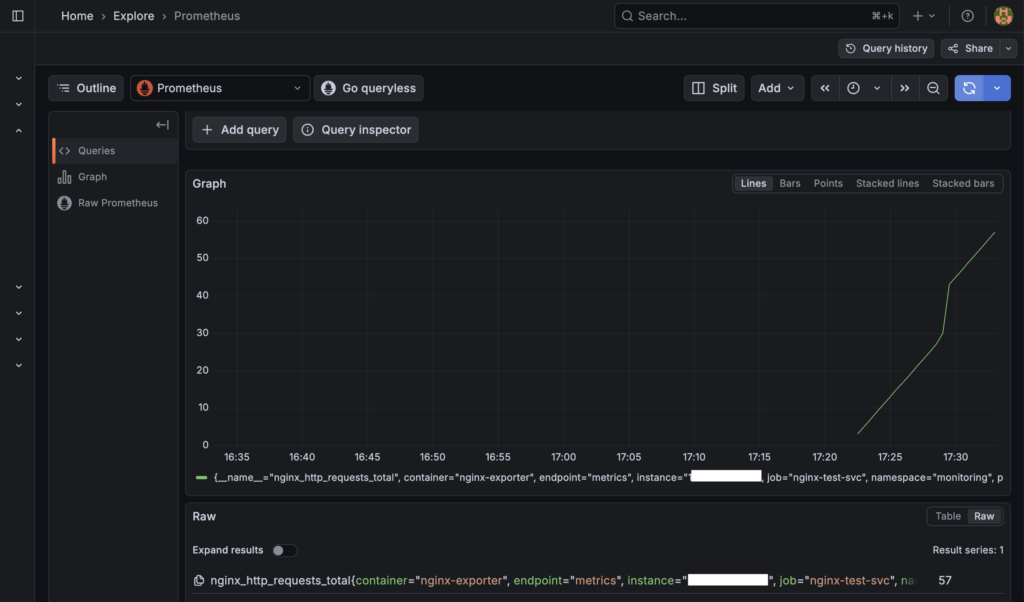
nginxへのアクセスがメトリクスとしてgrafanaで確認できました。
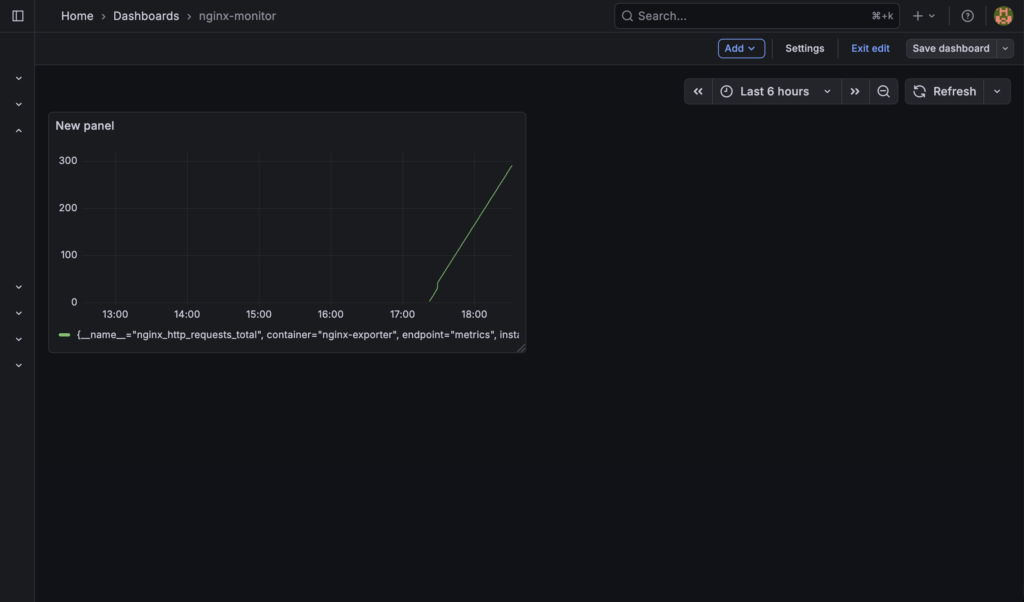
もちろんこのメトリクスから新たにダッシュボードを作ることもできます。
まとめ
今回はGKEのクラスタ建ててkube-prometheus-stackをインストール、nginxのメトリクスを監視するまでをやってみました。
やる前はもっと複雑な手順が必要なのかと思っていましたが、やってみたら意外と工程自体は少なくできました。
みなさんも小さなサービスからGKEに触ってみてはいかがでしょうか?
では、また。